
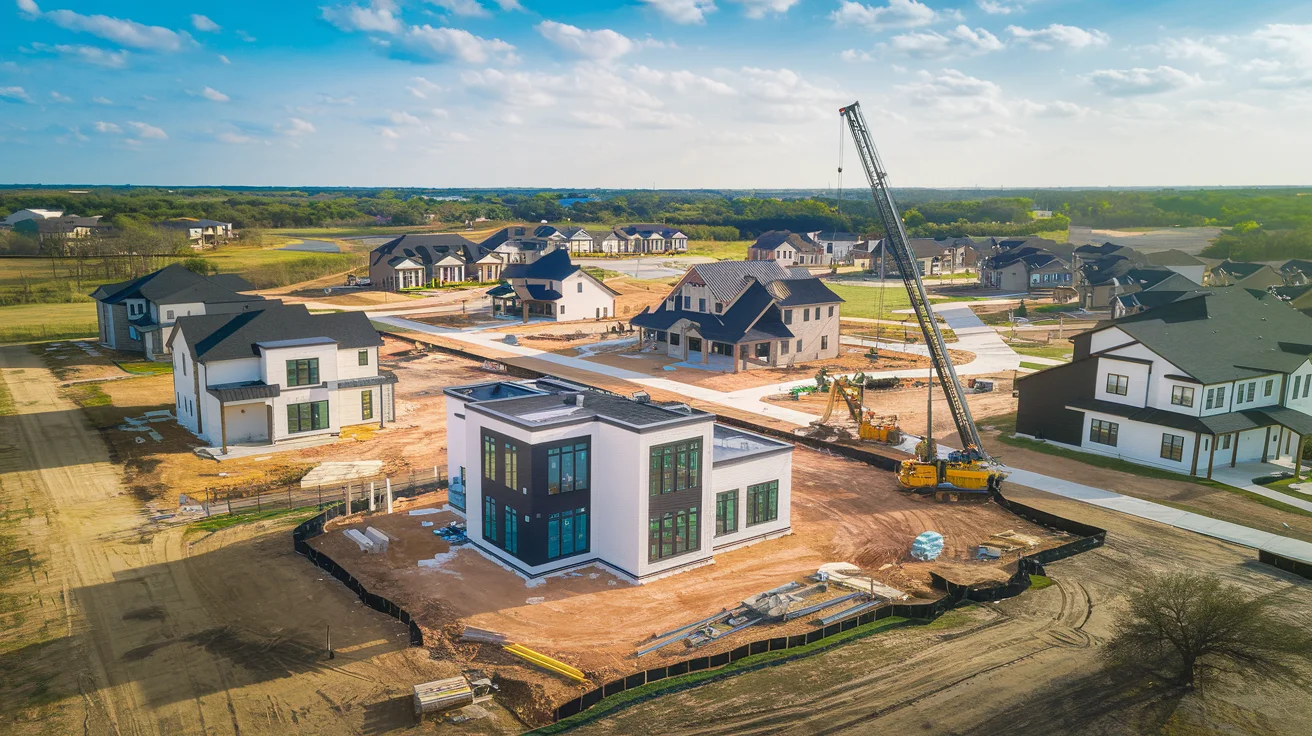
Between July 2023 and July 2024, Collin County grew by 46,694 people, ranking fourth nationally for numeric population gain. Only Harris County (Houston), Miami-Dade County, and Maricopa County (Phoenix) added more residents — and all three are metros three to four times Collin's size.
Since the 2010 Census, Collin County has taken on more people than live in Minneapolis today. Every new home needs an HVAC system. Every HVAC system needs installation, maintenance, and eventual replacement.
Collin County Population: 2010-2024
Decennial counts for 2010 and 2020, Population Estimates Program figures for 2015 and 2024. Source: U.S. Census Bureau Population Estimates Program, Vintage 2024.
| Year | Population | Change | % Growth |
|---|---|---|---|
| 2010 (Census) | 782,341 | — | — |
| 2015 (estimate) | 915,014 | +132,673 | +17.0% |
| 2020 (Census) | 1,064,465 | +149,451 | +16.3% |
| 2024 (estimate) | 1,254,658 | +190,193 | +17.9% |
14-Year Total: +472,317 residents (+60.4%)
Growth Rate Comparison
| Geography | 2023-2024 Growth Rate |
|---|---|
| Collin County | +3.87% |
| Denton County | +3.10% |
| Texas statewide | +1.83% |
| Tarrant County | +1.49% |
| United States | +0.98% |
| Dallas County | +0.75% |
Collin County grows nearly 4x faster than the country and about 5x faster than neighboring Dallas County. By raw headcount it is the second-fastest-growing county in Texas behind Harris; by percentage several smaller counties — Kaufman, Rockwall, Ellis — are growing faster. Rates are July 2023 to July 2024 (Census Population Estimates, Vintage 2024).
City-by-City Growth: Where the People Are Moving
| City | 2010 | 2024 | Change | % Growth |
|---|---|---|---|---|
| Plano | 259,841 | 293,286 | +33,445 | +12.9% |
| Frisco | 116,989 | 235,208 | +118,219 | +101% |
| McKinney | 131,117 | 227,526 | +96,409 | +74% |
| Allen | 84,246 | 113,746 | +29,500 | +35% |
| Prosper | 9,423 | 44,503 | +35,080 | +372% |
| Celina | 6,028 | 51,661 | +45,633 | +757% |
Celina: +757%
From 6,028 to 51,661 in fourteen years — more than eight times its 2010 population, and the fastest percentage growth in Collin County.
Prosper: +372%
From 9,423 to 44,503. Looking back further: Prosper had 2,591 residents in 2000, so it has grown more than seventeenfold in 24 years.
Frisco: +600% (since 2000)
From 33,618 residents in 2000 to 235,208 today. A 7x increase — Frisco is now bigger than Salt Lake City. About 41% of it sits in Denton County, not Collin.
Housing Construction: 88,000+ New Units (2020-2024)
| Year | Single-Family | Multi-Family | Total Units |
|---|---|---|---|
| 2020 | 10,847 | 3,947 | 14,794 |
| 2021 | 12,156 | 4,892 | 17,048 |
| 2022 | 11,234 | 7,254 | 18,488 |
| 2023 | 10,856 | 8,724 | 19,580 |
| 2024 | 10,412 | 8,401 | 18,813 |
5-Year Total: ~88,723 housing units authorized
Source: U.S. Census Bureau Building Permits Survey, Federal Reserve Bank of St. Louis (FRED)
HVAC Market Impact: The Numbers
Every new Collin County home requires HVAC installation. Using 2023 permit data (19,580 units) and average installation costs:
| Segment | Units | Avg Cost | Market Size |
|---|---|---|---|
| Single-family homes | 10,856 | $10,000 | $108.6M |
| Multi-family units | 8,724 | $5,000 | $43.6M |
| Total new construction | 19,580 | — | $152.2M |
Conservative estimate: $130-150 million annually
In new construction HVAC installations alone — not including replacements, repairs, or maintenance. This calculation is based on Census Bureau permit data and industry installation cost averages.
Population Projections: 2030-2060
The Texas Demographic Center produces official state population projections. Models show Collin County continuing to grow — but at moderating rates.
| Year | Projected Population | Change from 2024 | Cumulative Growth |
|---|---|---|---|
| 2024 | 1,254,658 | — | — |
| 2030 | ~1,500,000 | +245,000 | +20% |
| 2040 | ~1,850,000 | +595,000 | +47% |
| 2050 | ~2,150,000 | +895,000 | +71% |
| 2060 | 2,438,008 | +1,183,000 | +94% |
Key projection: Collin County is expected to nearly double from 1.25 million to 2.44 million by 2060.
What Collin County Growth Means for HVAC
New Construction Dominance
With 18,000+ housing units permitted annually, new installations represent the largest single market segment. However, as 2006-2020 housing stock ages into replacement, the balance will shift.
Workforce Gap
Collin County has approximately 25% fewer HVAC technicians per capita than the national average, despite 2.2x the cooling demand. Peak summer service delays are structural.
Northern Migration
As southern cities reach buildout, growth shifts northward. Between 2020 and 2024, Celina grew 206%, Princeton 117%, Melissa 88%, Anna 87%, and Prosper 48%.
Infrastructure Constraints
ERCOT projects potential capacity shortfalls by 2027-2029. Infrastructure constraints may affect AC sizing recommendations and grid-interactive equipment incentives.
How We Sourced This Data
Federal Government:
- • U.S. Census Bureau Population Estimates Program (census.gov)
- • U.S. Census Bureau Building Permits Survey
- • Bureau of Labor Statistics (bls.gov)
- • Federal Reserve Bank of St. Louis (FRED)
State Government:
- • Texas Demographic Center (demographics.texas.gov)
- • Texas Workforce Commission (twc.texas.gov)
- • Electric Reliability Council of Texas (ercot.com)